GBP/USD Price Analysis: Bearish exhaustion near supports keeps buyers hopeful
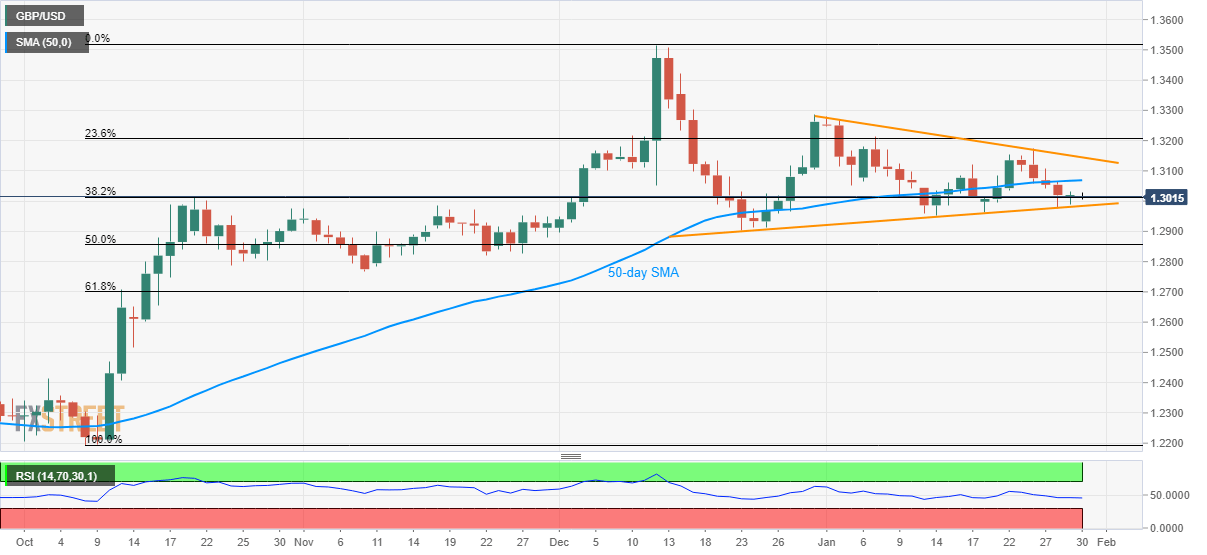
- GBP/USD clings to 38.2% Fibonacci retracement of October-December 2019 upside.
- An ascending trend line since December 23 also limits the pair’s near-term declines.
- 50-day SMA, a downward sloping resistance line from 2019’s end challenge the bulls.
GBP/USD stays mostly unchanged near 1.3015 during the Asian session on Thursday. The pair have recently lost momentum while trading around the key near-term supports, which in turn increases the odds for its pullback should the BOE offer positive surprises.
Not only 38.2% Fibonacci retracement near 1.3010 but a rising support line since December 23, 2019, currently at 1.2985, also challenges the pair’s sellers.
Should there be an increased selling pressure past-1.2985, backed by dovish BOE and/or a rate cut, the pair’s drop to December 23, 2019 low near 1.2900 can’t be ruled out.
On the upside, the pair needs to cross a 50-day SMA level of 1.3070 to aim for a descending trend line from the end of 2019, near 1.3145/50.
If at all the bulls manage to dominate beyond 1.3150, the pair’s recovery towards the high of December 31, at 1.3285, can be expected.
GBP/USD daily chart
Trend: Pullback expected