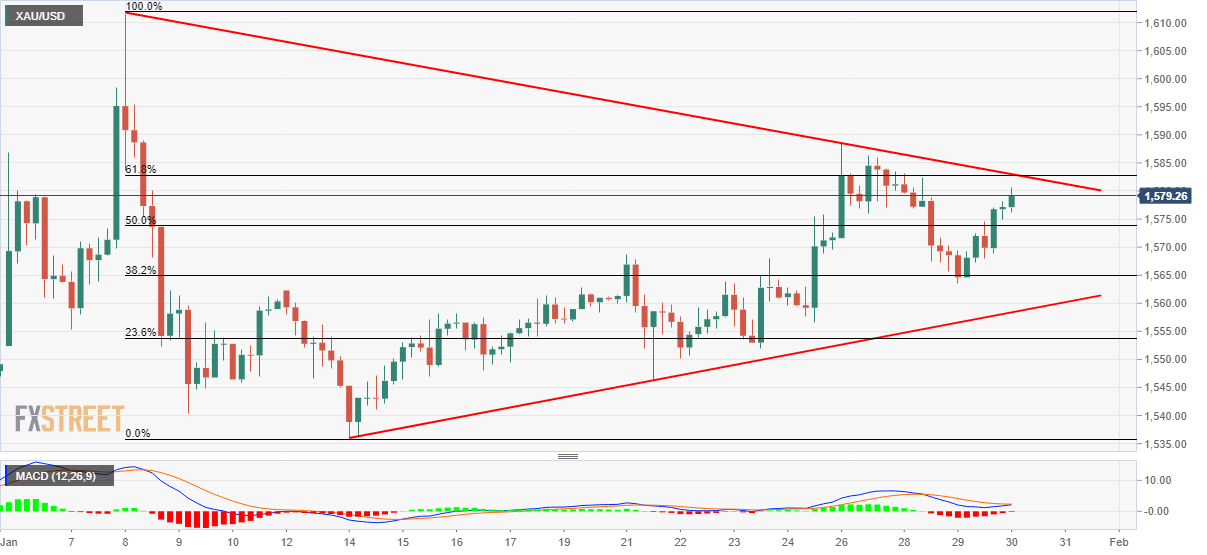
Gold Price Analysis: On its way to $1,582/83 resistance confluence
- The three-week-old falling trend line, 61.8% of Fibonacci retracement will question the latest recovery.
- A 12-day long ascending support line keeps the buyers hopeful.
Gold prices are up 0.16% to $1,579.50 during early Thursday. The bullion recently took a U-turn from 38.2% Fibonacci retracement of its fall from January 08 to 14. However, a descending trend line stretched from the monthly top and 61.8% Fibonacci retracement could keep buyers in check.
While the MACD’s latest pattern suggests its recovery, buyers can target $1,600 on the sustained break of $1,582/83 confluence. It should also be noted that the monthly top near $1,612 holds the key to the precious metal’s additional rise.
Meanwhile, 50% and 38.2% Fibonacci retracements, near $1,574 and $1,565 respectively, could entertain sellers during the pullback.
Though, an upward sloping trend line since January 14, at $1,558 now, keeps the buyers hopeful.
Gold four-hour chart

Trend: Pullback expected
