Back
2 Mar 2020
Gold New York Price Analysis: XAU/USD consolidates last Friday’s drop below $1600.00/oz
- XAU/USD remains under bearish pressure as the new week kicks in.
- The level to beat for bears is the 1593.00 support.
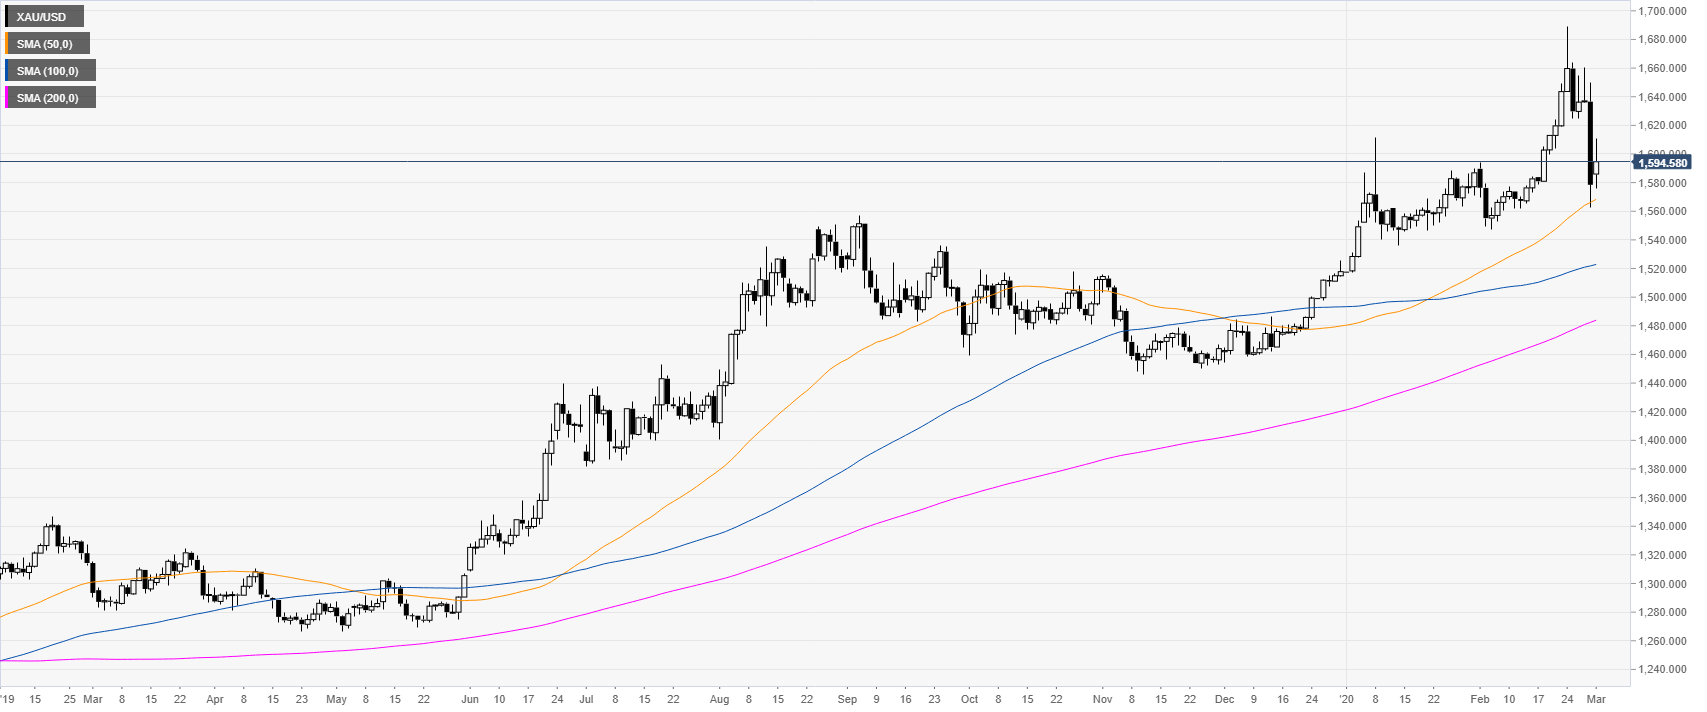
Gold daily chart
XAU/USD is in an uptrend above the main daily simple moving averages (SMAs). However, last week, the metal pulled down sharply trading off seven-year’s highs.
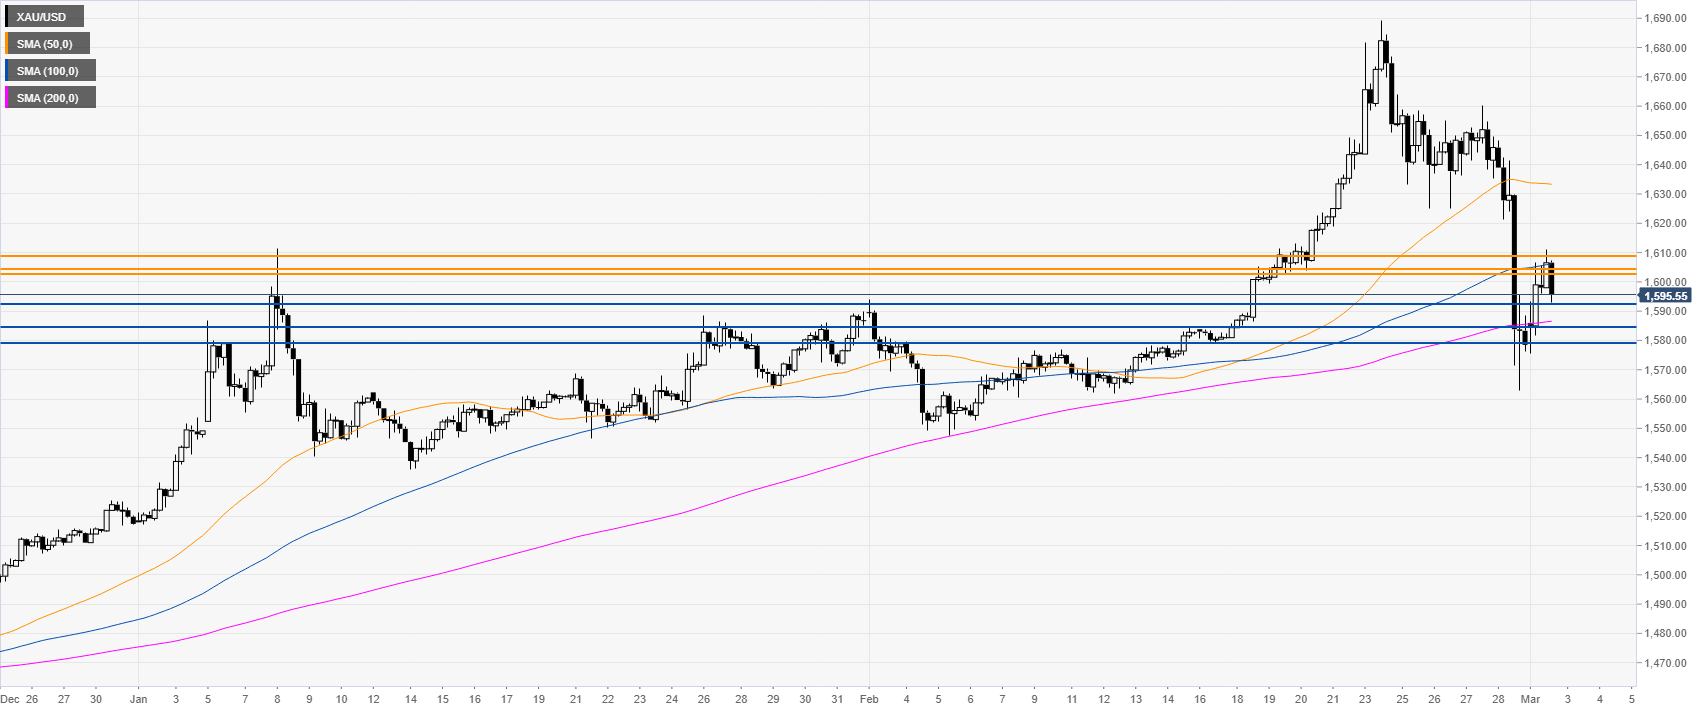
Gold four-hour chart
XAU/USD is trading below the 1600.00 figure and the 100 SMA as the market is consolidating last Friday’s drop. The market seems capped by the 1606.00/1611.00 resistance zone as sellers remain in control. A break below the 1593.00 support can lead to further weakness towards the 1586.00 and 1581.00 price levels, according to the Technical Confluences Indicator.
Resistance: 1602.00, 1606.00, 1611.00
Support: 1593.00, 1586.00, 1581.00
Additional key levels